Yookr in urban green
Data reports when you want them
We take care of that
Comparing data in reports about different locations in the city. Plan your next steps in greening cities even better with the help of our systems.
01 / What is happening in urban green?
How do you keep track of all your urban locations in clear data reports?
As a data analyst for urban green, you often look for connections between certain factors. For example, does the vegetation in a neighbourhood influence the temperature? Why is this the case in some neighbourhoods and not in others? A clear overview is needed for this.ïnvloedt de begroeiing in een wijk de temperatuur? Waarom is dit in sommige wijken wel het geval en in anderen niet? Hiervoor is een duidelijk overzicht nodig.
How do you keep track of multiple locations?
Different locations across different cities make it difficult to organise and report the data.
What influence does the weather have?
Neerslag, zonlicht, temperatuur en andere weersvoorspellingen beïnvloeden de teelt. Veranderende weersomstandigheden vragen om aanpassingen.
What measurable effects do green neighbourhoods have?
Greening can have various positive effects on neighbourhoods, such as lowering temperatures in the summer. But how do you facilitate this?
What do we learn from previous measurements?
Er zijn vaak veel gegevens beschikbaar, maar het herkennen van patronen en verbanden blijft lastig.
02 / This is how we help you further
Your knowledge of green and the city, combined with endless data
As a data analyst for urban green, you often look for connections between certain factors. For example, does the vegetation in a neighbourhood influence the temperature? Why is this the case in some neighbourhoods and not in others? A clear overview is needed for this.ïnvloedt de begroeiing in een wijk de temperatuur? Waarom is dit in sommige wijken wel het geval en in anderen niet? Hiervoor is een duidelijk overzicht nodig.
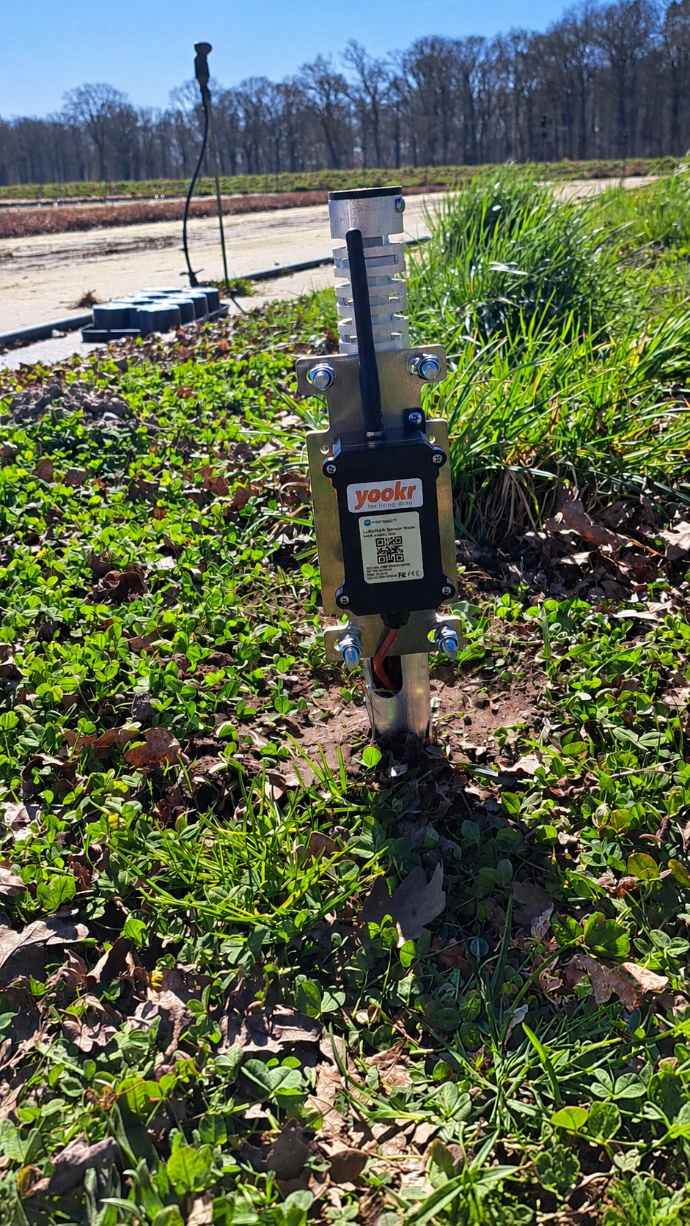
Measuring
Sensors collect data from the cultivation environment.
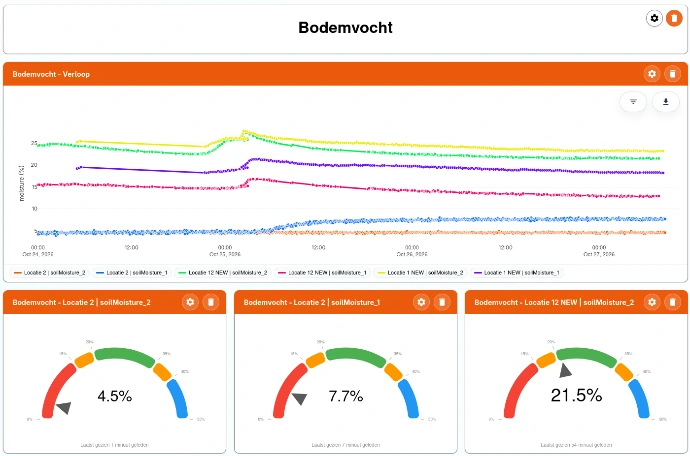
Insight
The dashboard makes measurements and changes visible.
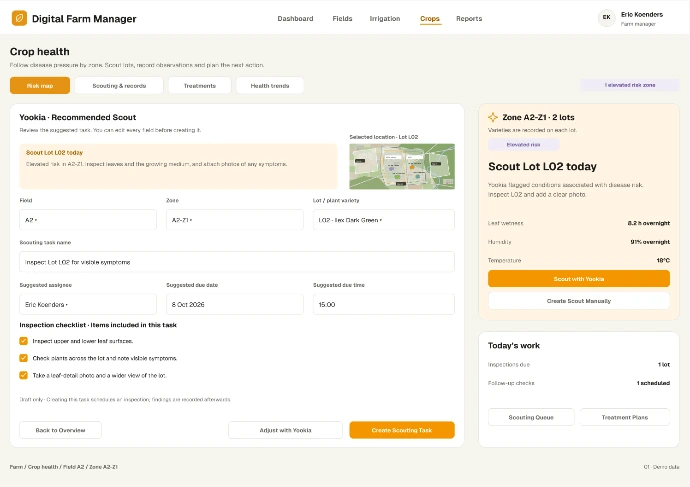
Action
The cultivation manager makes direct actions from all data points and assigns them.
03 / The solutions
A clear overview of your city
Complete data reports, automatically generated.
From your measured data, you create, with the push of a button, an immediate clear overview of your data. Set the time period, select the graphs or dashboards from which you want to export the data, and get a complete data overview right away.

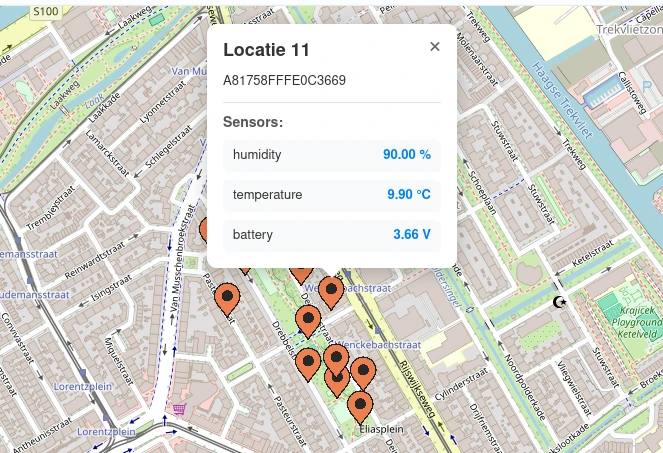
Compare locations and draw conclusions.
By comparing different locations in your city, you gain a good understanding of the effects that different types of vegetation have on the neighbourhoods. Additionally, you can keep track of how the growth and health of the vegetation has changed over time for each location, contributing to a greener and happier city.
04 / A practical example
What happens to the soil moisture after irrigation?
By comparing measurement data from before and after irrigation, you gain better insight into how the soil moisture reacts. Combine that with your own observations and the weather forecast to better support your next decision.
Trends
Find trends in your data with an AI-driven dashboard and use these to better understand your growth.
Vergelijk
Compare the trends of different locations with each other and gain more insight into how the vegetation affects the neighbourhoods.
Exporteer
Easily export your findings into a structured, presentable data report.
05 / Our projects
06 / Our vision
You know your crops. We help make the signals visible.
Nature constantly tells us something. But not every signal is immediately visible or easy to understand. By bringing together measurement data, technology, and your practical knowledge, we aim to make more and more connections clear.
Because everything is connected.
" Green data is what connects us. The strength of Yookr in our collaboration is Together. Actively listening, developing, and turning into actions is what Yookr helps us with to sustainably green public spaces. "

" The biggest advantage is peace of mind and certainty.
The entrepreneur can check from home whether the products/plants have received water or not. "
" Yookr is a party that seeks connection with other parties and is always looking for new challenges and trying to get the most out of the collected information and knowledge. "

" By continuously cross-checking data and by continuing to work with Yookr on software development, we are making progress step by step. "

" I am satisfied with the use of moisture sensors from Yookr. Furthermore, Yookr has a good and quick helpdesk for questions. "

Partners & Clients
At Yookr, we believe in the power of collaboration. Together with our clients and partners, we combine knowledge, technology, and practical experience to realise innovative solutions.


Contact
Chat with us or fill in this form to get information about everything related to Odoo apps, services, and our company.